e.g. 500 to 2,000 ha of municipal forest
Municipality, Fulda district
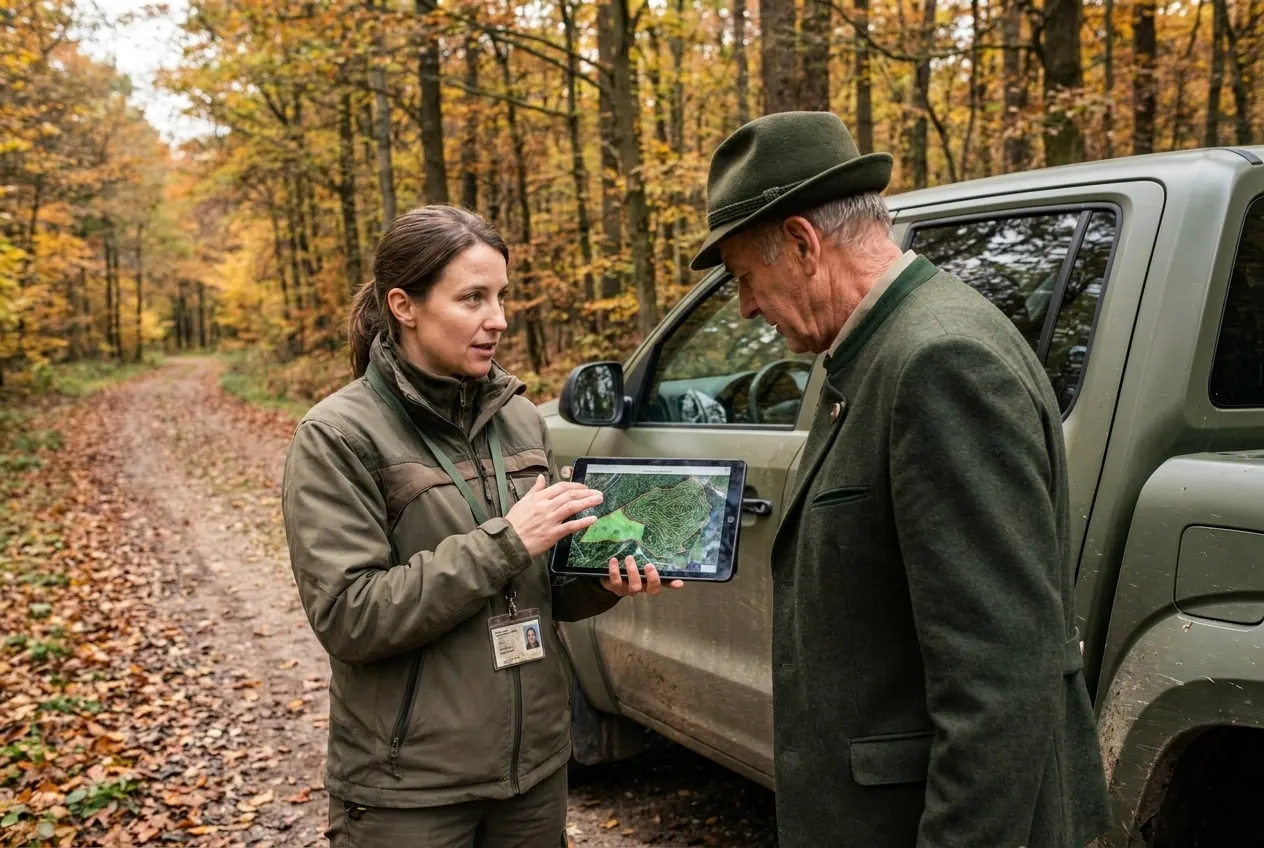
Forest condition report for the municipal council with maps and recommendations on forest conversion. The key findings are summarised on a few pages.
S-10 · Analysis and reporting
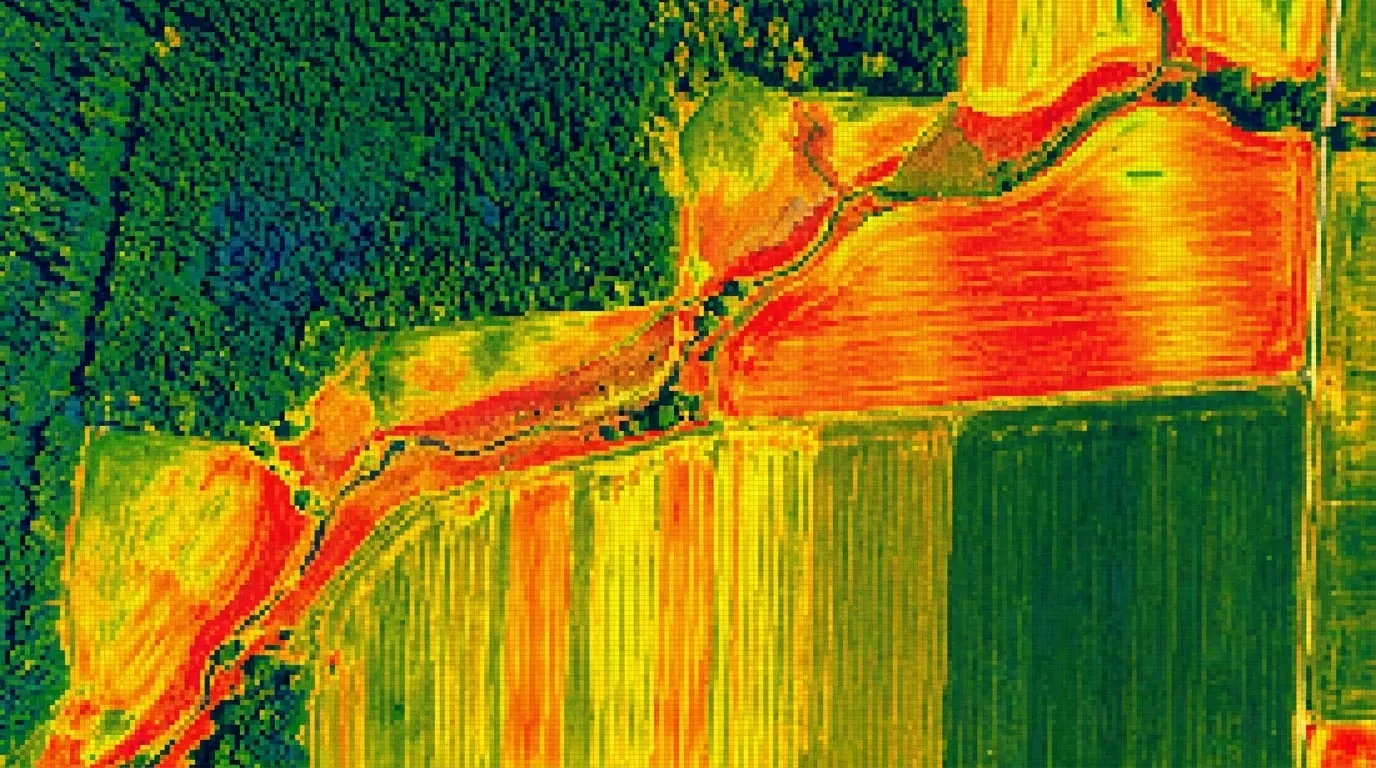
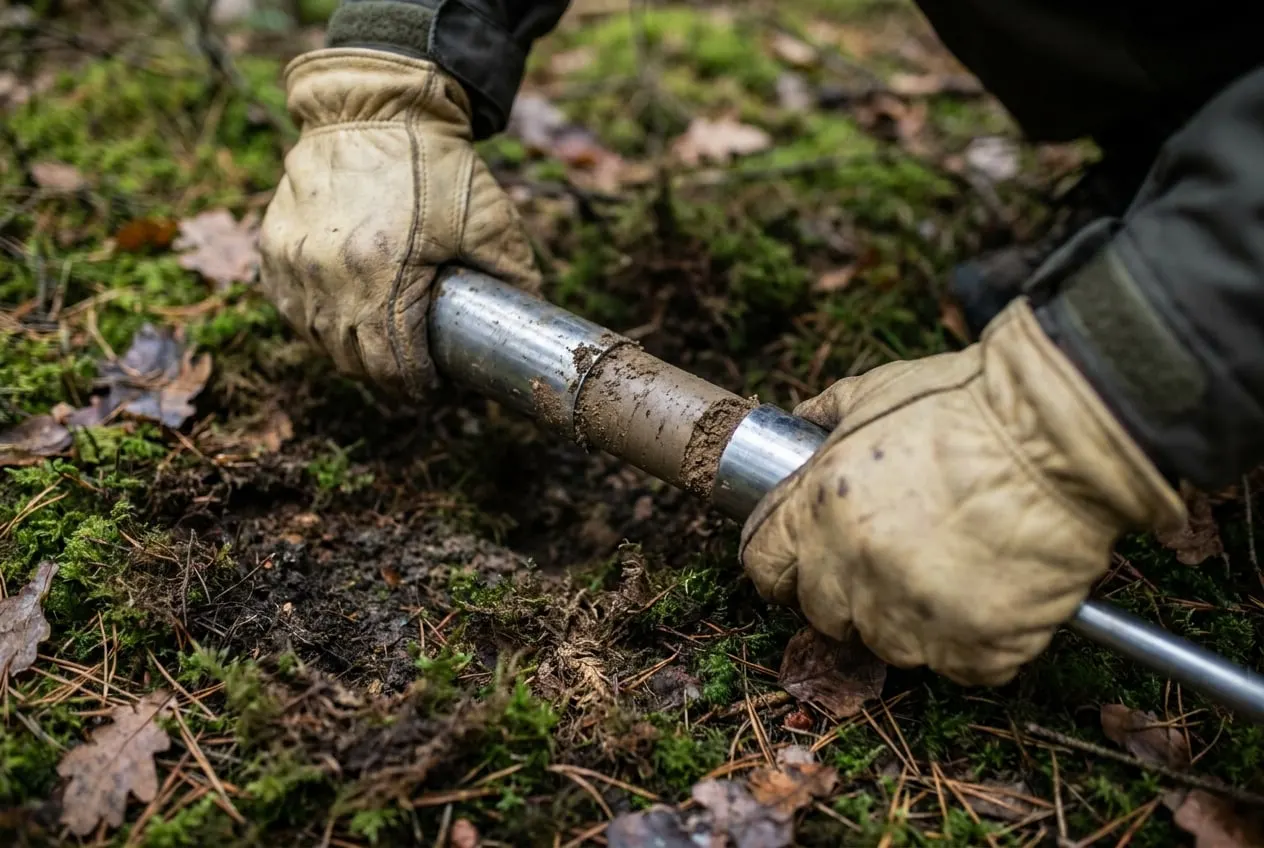
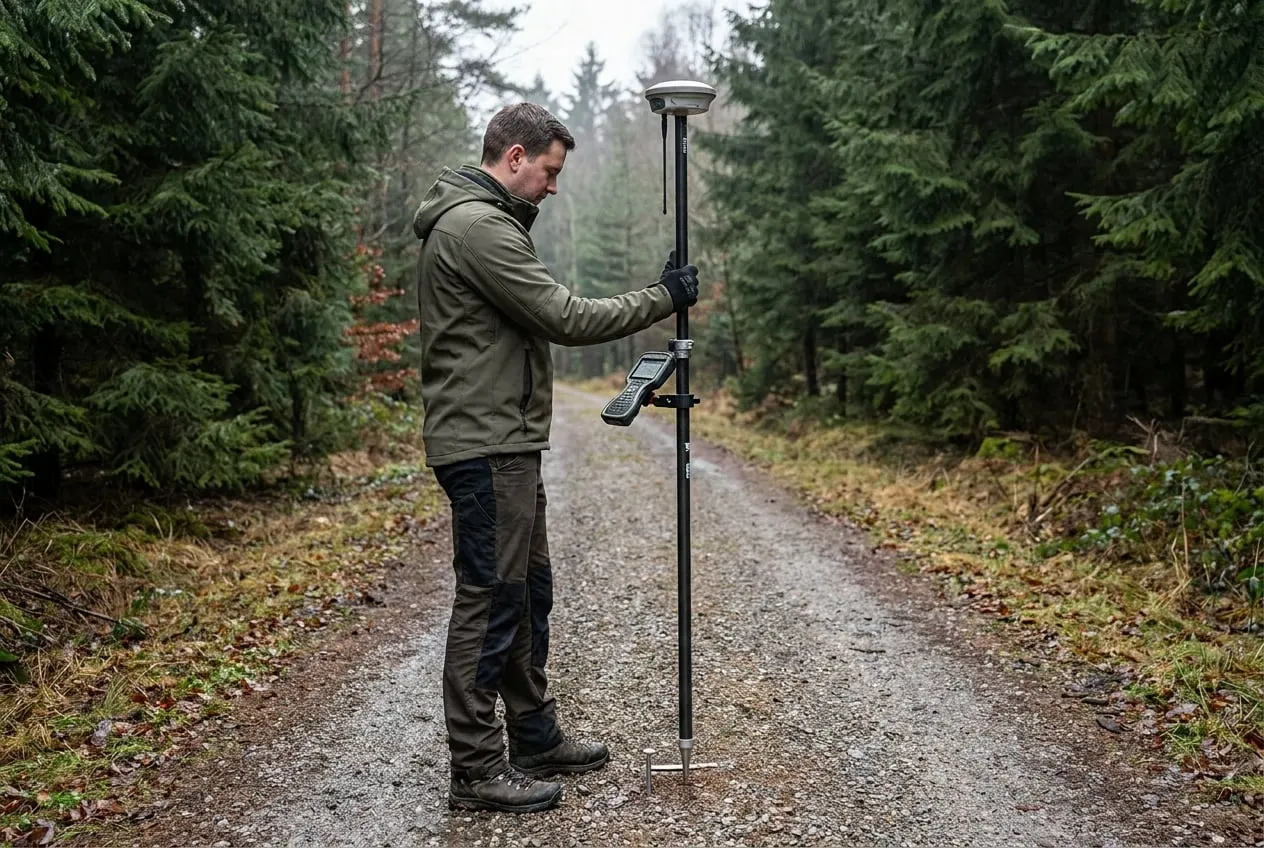
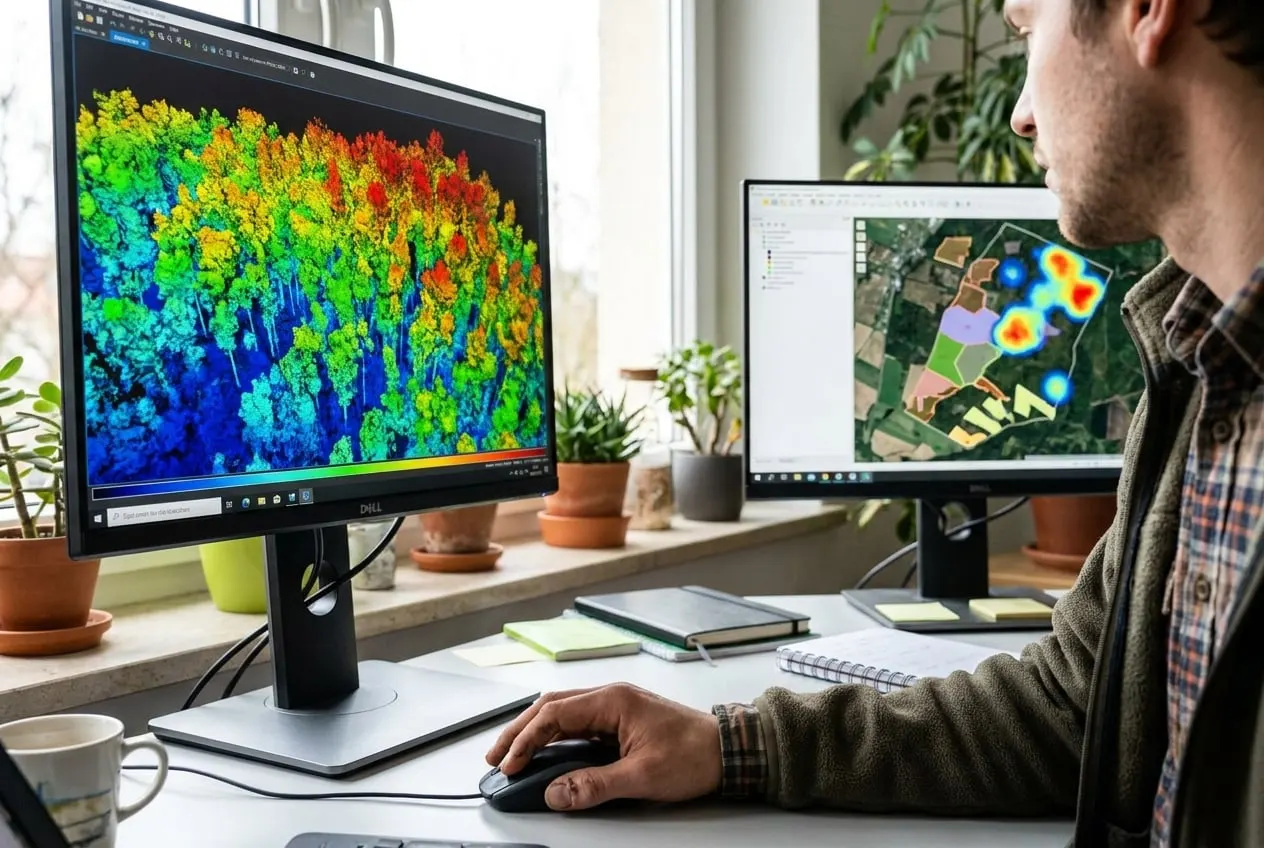
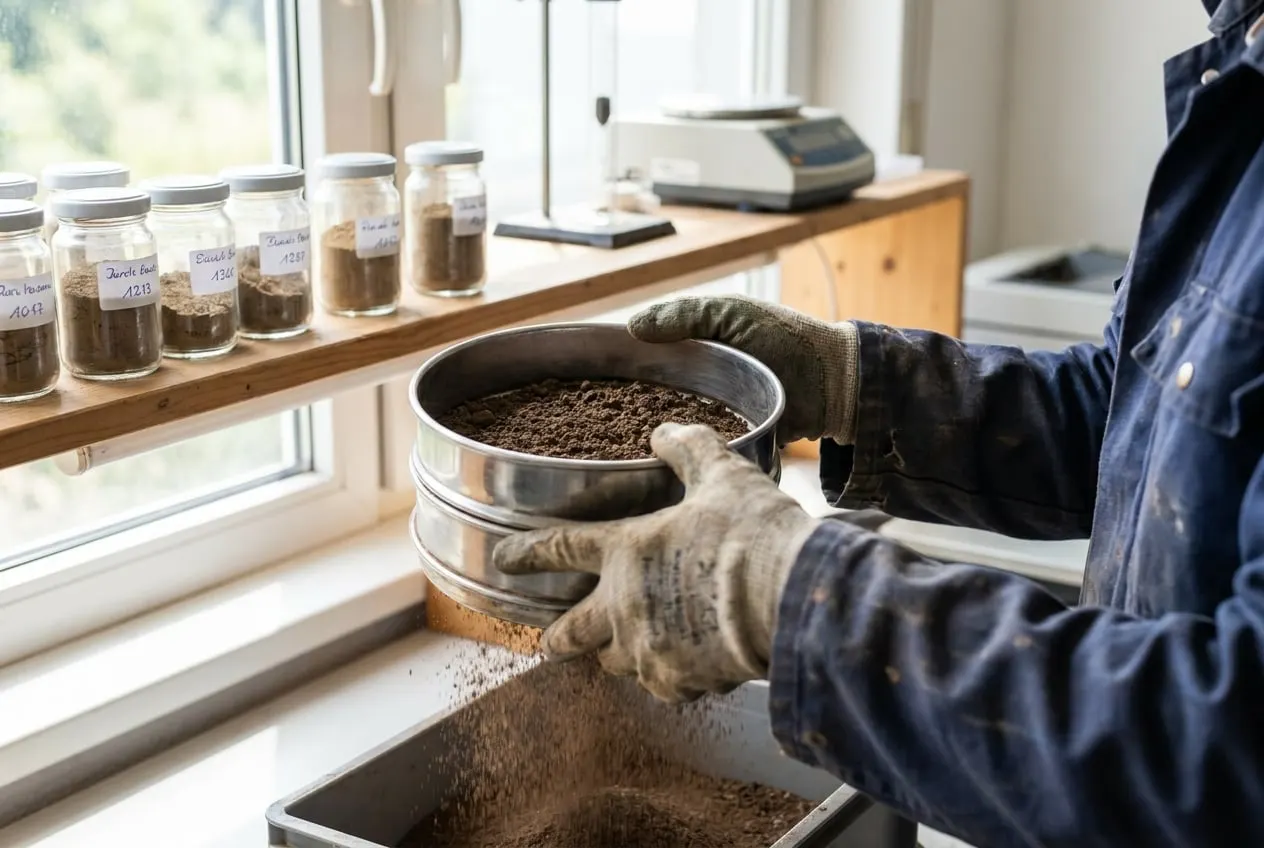
We combine data from aerial surveys, fieldwork and partner laboratories into reports that support decisions. Every report includes a summary and details of methodology, uncertainties and the limits of the conclusions.
How we carry out this service.
01The first step is to clarify the question: which decision should the report support, what level of accuracy is needed and which data already exist? From this we develop a study design with methods, sample size and timetable, which we agree with you in writing before data collection begins.
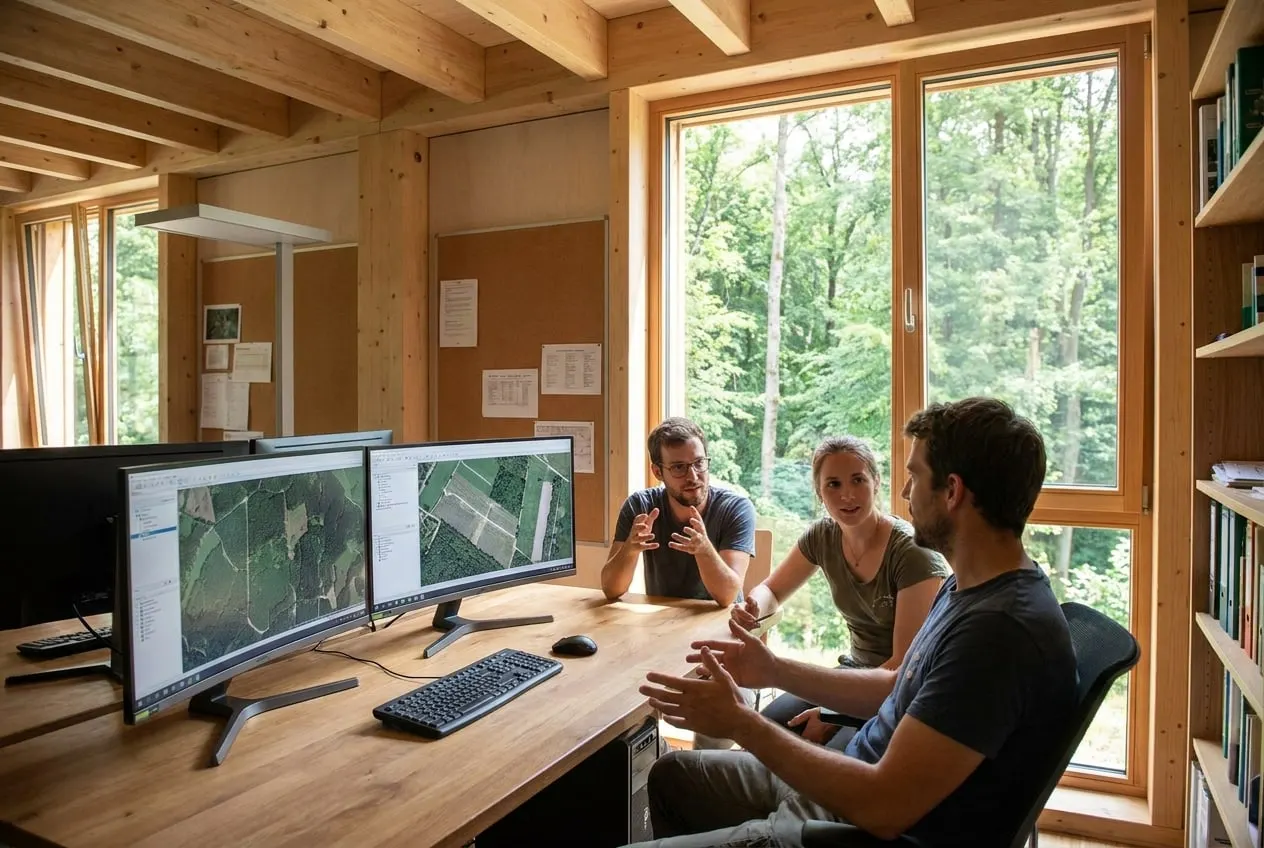
02Analysis in the GIS follows the four-eyes principle: one person carries out the calculations and a second checks the input data, reference system and results. Remote sensing results are checked for plausibility against reference plots and laboratory values. Third-party data are only used after checking their origin, capture date and positional accuracy.
03Every report opens with a one-page summary and clearly separates findings, assessment and recommendations. Methodology, measurement uncertainties and the limits of the conclusions are set out in separate chapters. Reports are released by the responsible head of department, and laboratory findings by our laboratory coordination.
Operating in Germany and the EU
e.g. 500 to 2,000 ha of municipal forest
Municipality, Fulda district
Forest condition report for the municipal council with maps and recommendations on forest conversion. The key findings are summarised on a few pages.
e.g. 5 to 30 km of route
Utility line developer, Germany
Evidence preservation along the forest edge before and after construction of a utility route. Dated imagery makes later damage to edge trees traceable.
The examples show typical procedures for this service.
Crown condition and vitality by tree species, causes of damage, changes since the previous year and recommendations, plus maps, methodology and an assessment of reliability.
A dated, georeferenced record of the current condition, for example before construction work. If damage occurs later, it shows what has changed.
Yes. We take over aerial images, point clouds, inventory and laboratory data from other sources, check their quality and reference system and analyse them together with our own data.
Tell us the area, location and time frame. You will receive an assessment within two working days.